
Return on Quality (ROQ)

A missing income document, a missed requirement, a delivery issue surfaced too late—these small gaps can become costly disruptions as a loan moves from origination through servicing.
Freddie Mac’s Return on Quality (ROQ) insights explore how upstream defect prevention creates measurable operating value across the loan lifecycle. The report dives into the opportunity to make loan manufacturing outcomes (such loan defects and quality control findings) – or what we refer to as “loan quality” – more than a final checkpoint but a measurable part of how lenders manage costs, capacity and execution.
The Highlights
Part 1: Why Loan Quality Matters More Now
- Rising costs make preventable rework harder to absorb. Average retail loan production costs increased 36% in the past five years, while purchase-heavy lending and varied income documentation add complexity.
- The cost of loan defects increases as the loan moves further downstream. A small issue at intake can become rework, a closing delay, a delivery exception or a servicing problem if it moves downstream.
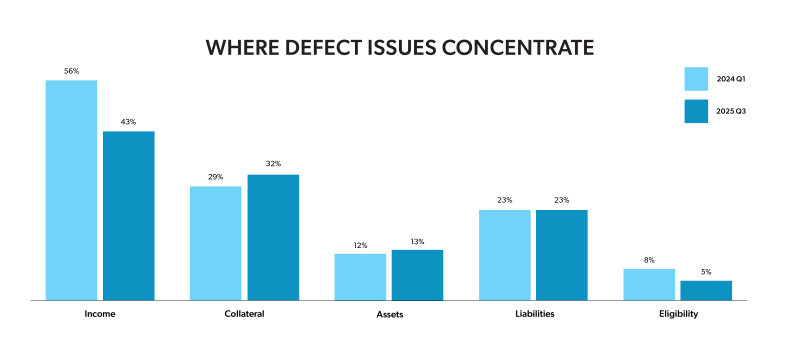
- Defects concentrate in certain areas. Income, assets and collateral accounted for 88% of major defect findings.
Part II: Digital Capabilities as the Quality Foundation
- Greater digital use can reduce defects and improve efficiency. Loans that used automated capabilities in Loan Product Advisor® (LPA®) such as automated collateral evaluation (ACE) and asset and income modeler (AIM) together had a 1.8% Non Acceptable Quality (NAQ) rate—2.5x lower than loans without representation and warranty (R&W) relief.
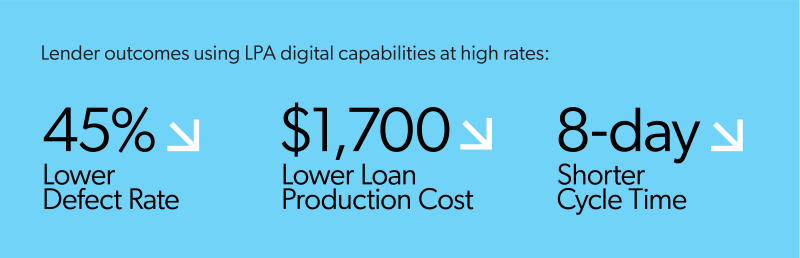
- Higher LPA digital tool usage is also associated with fewer defects, lower costs and shorter cycle times.
Part III: Return on Quality: Measurable and Scalable
- Defect prevention creates value across four cost areas: reverification, defect resolution, repurchase exposure and servicing.
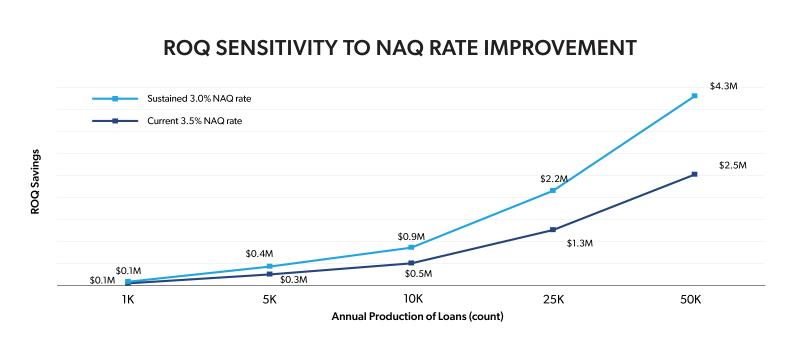
- Our illustrative model estimates approximately $500,000 in annual avoided costs—or $50 per loan—for a lender originating 10,000 loans annually.
- Potential value grows with production volume and sustained quality improvement.
Part IV: Best Practices for Moving from Quality Insight to Action
- Target recurring defects early, focusing controls and escalation on income, assets, liabilities and collateral.
- Make digital capabilities part of daily operations, using eligible automated assessments consistently and resolving issues before delivery.
- Measure results and close the feedback loop. Track quality alongside adoption, cycle time and rework, then use recurring findings to improve training, checklists and controls.
Training
Increase your use of LPA digital solutions to reduce defects and improve efficiency.
- AIM training resources – automate assets, income and employment assessments.
- ACE training resources – automate appraisal waiver eligibility assessments.
Data and Reporting
Track digital adoption, monitor outcomes and keep improving. Log into ECO®–our business intelligence tool that provides you with portfolio analytics and peer comparisons optimize performance. Helpful reports include:
- AIM Performance – View utilization and representation and warranty (R&W) relief trends.
- Collateral Offerings Utilization – View LPA submission trends and compare with loan delivery.
- Loan Defect and QC Findings – View delivery performance, NAQ rates and defect trends.
- Days Saved with R&W Relief – View tangible time savings achieved through automation and compare against the broader industry.
Participate
Learn about the Performing Loan Repurchase Alternative Pilot program – a fee-based structure that is more efficient, transparent and rewards lenders that deliver high-quality loans.
Subscription Center
Get and stay connected with Freddie Mac Single-Family. Subscribe to our emails and we'll send the information that you want straight to your email inbox.